


In today’s business environment, learning programs that are unable to prove that benefits exceed costs are unlikely to survive.
In March, global training company ESI International conducted an ROI study, “Training ROI for the Project Community,” with more than 30,000 respondents, which demonstrates that the benefits of calculating ROI extend beyond the numbers to include expanded decision-support capabilities and an accountability mindset.
ROI is not a number; it is a story that supports the idea that value is being created in the business. Business stakeholders need to see where and how value occurs because only then is an ROI calculation actionable. Specifically, they need to understand how learning affects job performance and where business results are impacted. Answering these questions makes the case for learning, provides key measurement milestones and shifts the learning and development culture to align with business goals and objectives.
Building Decision-Support Metrics
Getting to ROI is like building a court case. Arguments are made, facts are presented and ultimately a conclusion is drawn. The first step in proving ROI is to map out a chain of logic that supports the argument and provides quantifiable evidence of value. Decision-support metrics are one benefit from this process. The value chain created in the ESI study proved:
• A high-quality learning event took place.
• Students learned the content.
• The learning improved job performance.
• That improvement had a positive impact on the business.
• That impact resulted in a financial benefit to the company.
• That benefit was greater than the cost of the training.
ROI cannot be credibly calculated without showing value along this chain. In the ESI study, each of these steps was quantified by surveying students and their managers.
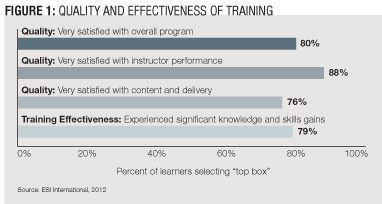
Quality indicators are calculated consistently in most training programs to determine satisfaction with the instructor, content, learning environment and overall program experience. Although it is important to understand if an instructor is not performing adequately or if the content is missing the mark, quality measures do not go nearly far enough to determine effectiveness. The next step, which is often overlooked, is to determine whether the student gained significant knowledge and skills from training.
For the quality and effectiveness measures, the study used a top box analysis, which only considers the percentage of students who rated each question as a six or a seven on a scale of one to seven (Figure 1). For quality issues, top box analysis works because it tends to be conservative and sensitive to quality problems which might otherwise get averaged away.
Once quality and learning effectiveness were established, the study set out to understand how the learning affected the student’s ability to do his or her job and to identify what obstacles the individual encountered when trying to apply newly learned knowledge and skills. To be conservative, the study included three layers of evaluation; a post-event student evaluation, a follow-up student survey 60 to 90 days after the event, and a follow-up manager survey 60 to 90 days after the event.
Figure 2 shows the types of job impact questions the study asked and the responses. Learners were asked about their ability to apply learning on the job and the extent to which the training had improved their effectiveness. These measures provide a good indication of what is happening on the job after the learning event. From an ROI perspective, job impact measures are important to understand because a negative ROI is possible even when relevant and effective training has been delivered. ROI is negatively impacted when training is not applied.
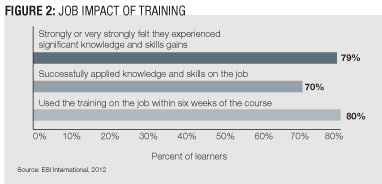
While all job impact numbers are helpful in determining the effect training is having on work performance, one particular number is critical in determining ROI — the percent improvement in productivity directly attributed to the training.
Figure 2 provides job impact metrics used in the ESI International study to ensure that learning is adopted and put into practice. When it comes to calculating impact, it is important to be as conservative as possible by using data from the follow-up survey 60 to 90 days after the event. If a follow-up survey is not available, factoring the post-event survey is an acceptable practice.
According to research from learning measurement company Knowledge Advisors, students overestimate job impact in post-event assessments by approximately 35 percent, so applying a factor of 0.65 to the post-event survey score is appropriate. Further, a sampling of responses should be reconciled with the delegate manager’s opinion when possible. If stark variances exist, additional factoring should be considered.
When reporting ROI back to the business, job performance should be translated into business value because that is ultimately what leaders need to see. In the ESI International study, this was accomplished through a follow-up survey delivered 60 to 90 days after the learning event, which asked how the training affected specific business outcomes. Figure 3 shows the questions ESI asked students and managers, charts the percent of users who experienced improvements for each outcome, and presents the average percent improvement for all users that resulted directly from the training.
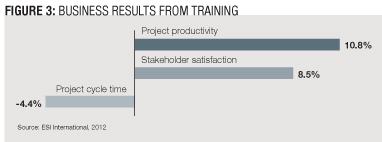
The questions used to calculate business results were similar to those used for job impact. First the students were asked to select which business results were measurably impacted by the training. Then, for outcomes selected, they were asked to estimate the impact directly related to the training. Since the study included more than 150 organizations, high-level business objectives acceptable for most organizations were used. Where possible, outcomes should be tailored to represent the specific goals and objectives for specific business sponsors.
Calculating ROI
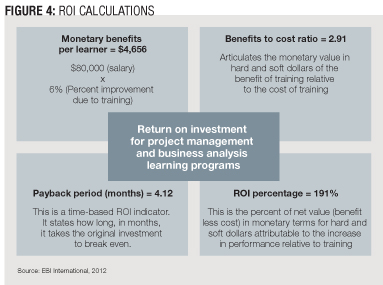
Though ROI is technically a single calculation, there are a few additional ROI-related derivatives that can be performed to help communicate business impact more effectively. Measures calculated in the ESI study include ROI, monetary benefit per learner, benefit-to-cost ratio and average payback period (Figure 4). An explanation of each calculation follows.
Return on investment: Determining training’s contribution to performance improvement is the single most important measure in calculating ROI. In the ESI International study, performance improvement was calculated to be 8.95 percent. For the ROI calculation, however, this number was factored down to 5.82 percent — 8.95 percent x 0.65 — in an effort to be conservative.
ROI is calculated as the dollar increase in productivity due to the training divided by the investment in the training (costs). In the study, the productivity increase was derived by taking the average student salary and multiplying it by the average performance increase, $80,000 and 5.82 percent, respectively. Training costs should include the per student loaded tuition costs including courseware, instructor cost, venue costs and snacks. In the study, these were estimated to be $1,600. The ROI calculation used is as follows:
• Return = $80,000 (average salary) x 5.82 percent (performance increase) = $4,656.
• Investment = $1,600 (fully loaded class cost).
• ROI = ($4,656 – $1,600) / $1,600 = 191 percent.
Monetary benefit per student: This number shows the return component of the ROI calculation without reference to cost. In the study, the training generated $4,656 in monetary benefit for each student taking the course.
Benefit to cost ratio: This ratio articulates the monetary value of the training relative to the cost. For the study, the companies investing in training received $2.91 for every dollar they invested in training. Therefore, the benefit to cost ratio was 2.91 to 1.
Payback period: This is a time-based ROI calculation, which indicates how many months it will take to pay back the initial training investment. To calculate the payback period, the per student monetary benefit is divided by 12 (months) to get the monthly benefit. The investment is then divided by the monthly benefit to get the payback period:
• $4,656 (annual benefit) / 12 (months) = $388 (monthly payback).
• $1,600 (investment) / $388 = 4.12 months to pay back the investment.
Aligning With Business Objectives
ROI is much more than a series of numbers — it is a mindset. Extending program performance indicators to include learning effectiveness, job performance and business results shifts the focus of the program from training delivery to business impact. It is an important shift because it directly aligns training with the goals and objectives of the business. However, it may be more difficult than one might think.
Developing a business-focused learning program requires a willingness to accept responsibility for students’ actions after they leave the learning event. Since ROI depends on adoption and adoption occurs after training, making the ROI transition requires expanding the learning and development remit to consider on-the-job activities.
This can be a difficult leap of faith since many of the factors that affect adoption are beyond the learning organization’s reach. A strong survey approach, such as the one used in the ESI International study, allows the organization to identify adoption obstacles and provide feedback to the business. However, if learning is not willing to take the next step and aggressively influence adoption practices through coaching and mentoring programs, post-event learning support or other reinforcement activities, ROI will suffer.
Learning organizations that are willing to change their definitions of success and align themselves with their business sponsors in practice and mindset are much more likely to provide measurable value and deliver tangible results.
Mark Bashrum is vice president of corporate marketing and strategic intelligence at ESI International, a global training company. He can be reached at editor@CLOmedia.com.