

Return on investment for learning and development is a major topic among learning teams in organizations today. Of the 1,469 respondents to Chief Learning Officer’s October 2020 “Learning State of the Industry” survey, 26 percent said they currently measure formal ROI for learning, 24 percent said they plan to begin doing so in the next 12 months and an additional 13 percent plan to within the next 12-24 months. However, only 24 percent said they report these ROI measures to company executives.
Having a perfect understanding of how much every dollar invested in learning is bringing back to the business is key to having a say on the amount of investments deployed by the organization. This would in turn improve the influence of learning and development departments when it comes to leading transformations within the organization. Moreover, clearly identifying the return on each and every program can allow us to reinforce those that are bringing the most return and revisit those that are underperforming, clearly increasing the impact of the L&D effort.
Obviously, measuring the impact of learning efforts is tough. Many variables can influence the results of development efforts, and isolating the effects of training among everything else that is constantly happening in the organization is very difficult. This is even more complex for large organizations that have, by definition, many people in different L&D programs all the time. We therefore need to be creative when building these measures and integrating them systematically into our learning functions.
I’d like to present an interesting way to start looking at the macro picture of the ROI of learning efforts inside an organization. This approach can allow an organization to verify the impact of the learning in general, checking its impact on key financial business metrics (e.g., sales, profit) and crossing these alongside different categories of learning efforts. The context we will use to describe this technique is a retailer with multiple stores. However, this approach can be used for organizations in various industries..
The starting point of this method is the definition of the two key variables we want to study: learning effort and business metrics. For the sake of this example, let’s say the training efforts are measured using the percentage of people who participated in a training session over the total number of employees in one particular store. For example, if a store has 100 employees and 10 employees participated in a training session during the past year, this store has a training effort score of 10 percent.
Note that we also define the unit inside the organization that we will use (in this retail example, the store). We could easily use other units in functions of the industry we are working with. For example, a manufacturer could use their factories or their business units as the unit of analysis for learning impact.
The second metric we need to define is the business one. The best variable here is the one that is the most relevant for the organization. For some organizations, this measure can be the EBITA, while others would prefer to use sales. In this example, we will use the total sales measured in dollars during the year for each one of the stores.
To avoid skewed results due mainly to size (i.e., large stores can send more participants to training sessions than small stores), we suggest using the variation of training effort and sales compared with the previous year. The graphic resulting from crossing these two variables would look similar to what is depicted in the figure below.
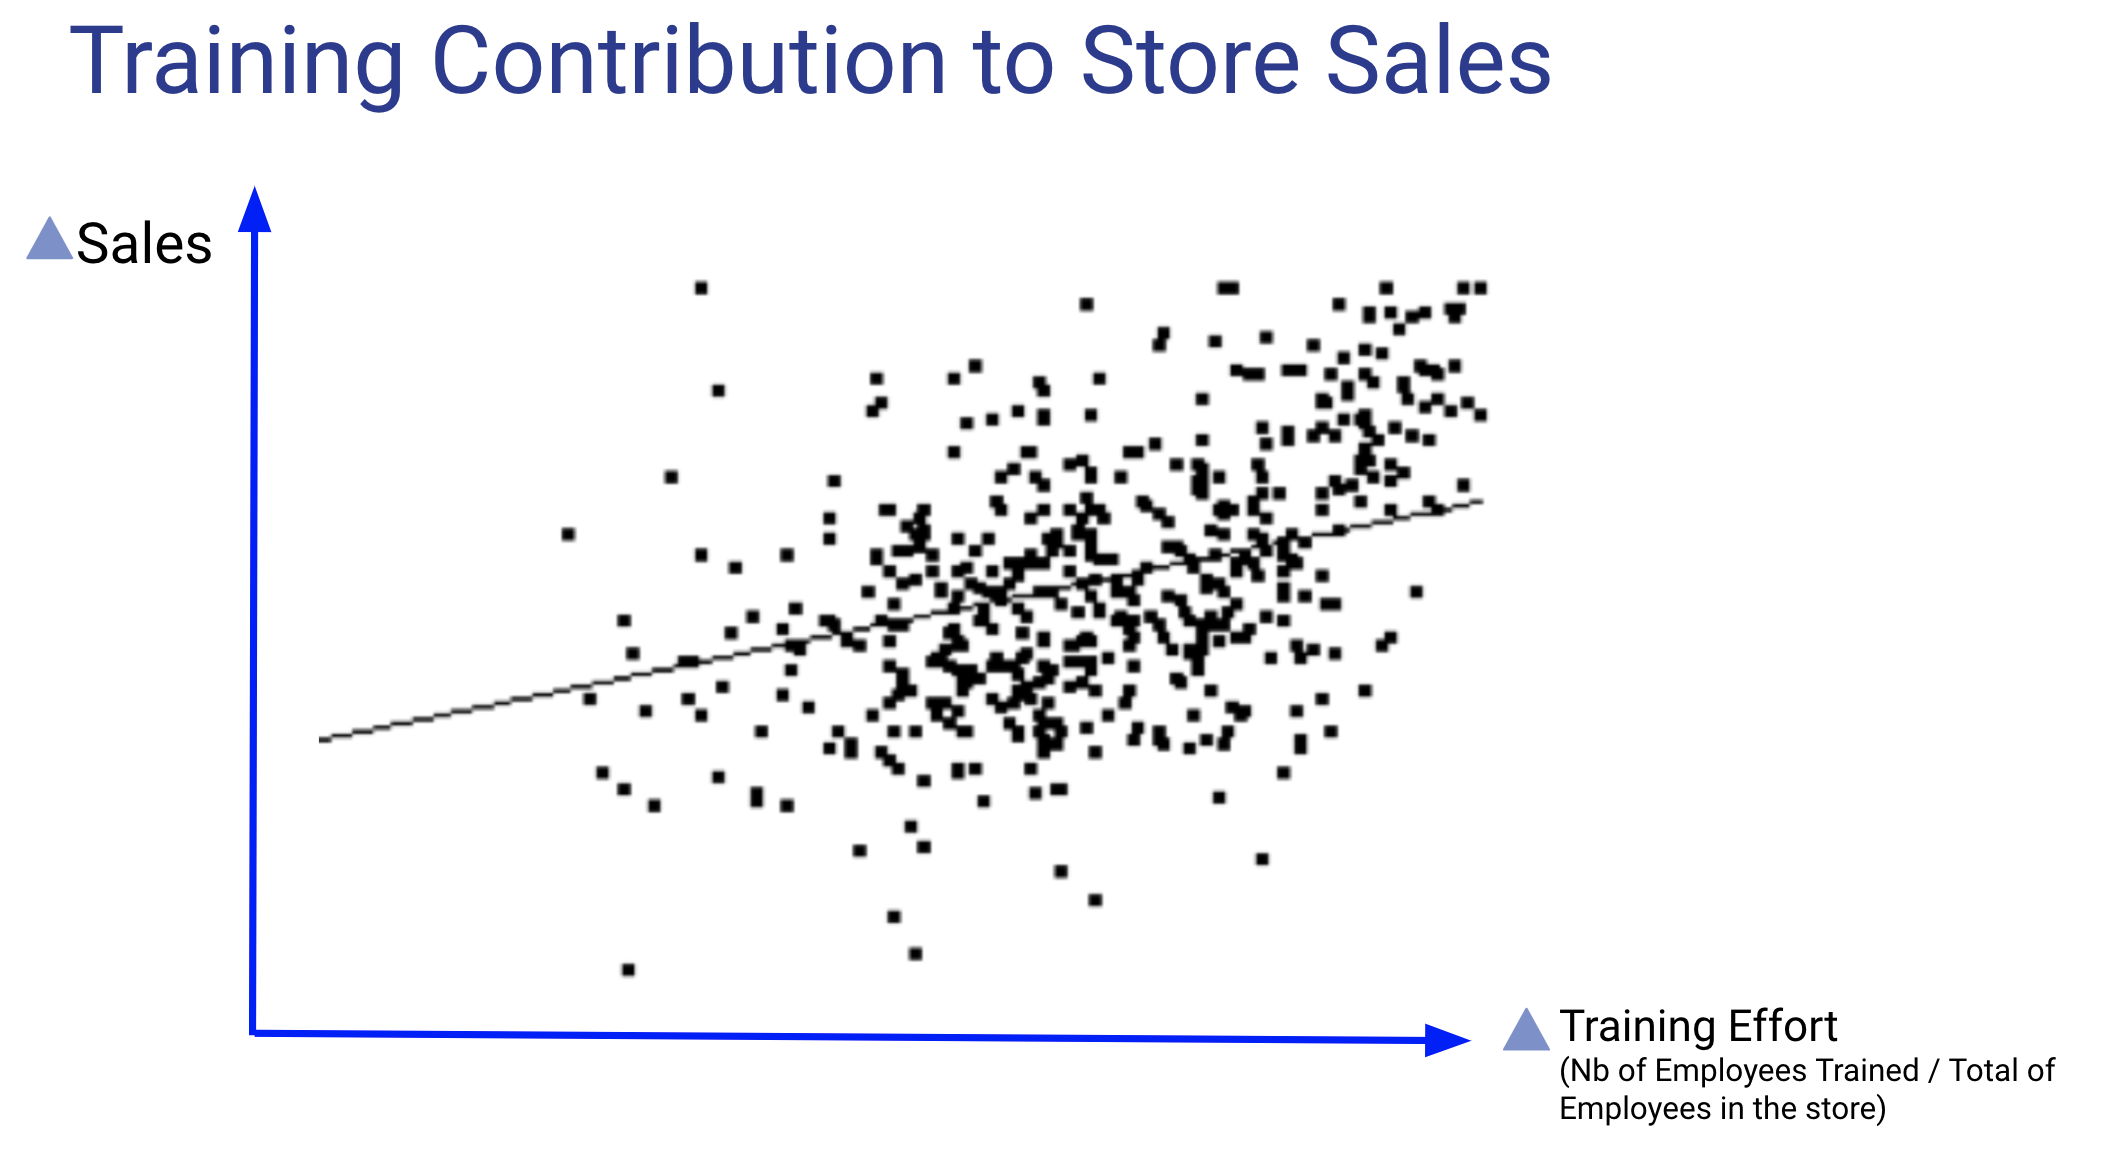
One can easily see that the relationship is positive and significant between the two variables. In this case, the more the training effort increases from year one to year two, the more the sales increase in the stores during the same time period. Even if correlation is not causation, this is an interesting metric. One could obviously look more deeply from a statistical standpoint, particularly at the correlation index itself as well as the level of significance, but that is beyond the scope of this article.
After this first and general approach that already brings some good insights for the organization, we can make things a bit richer, with greater managerial impact. For instance, we could include the cost of each training session, including the salary costs of the employees when they are not working but involved in the training. Therefore, we translate the training effort from the number of employees trained in each store to the amount of money invested by the store in training. All other elements presented above could be done similarly. This way we can calculate the learning ROI, meaning how much each dollar invested in learning adds to sales of the store on average.
The measure of learning ROI could then be standardized and used to benchmark different actions of learning effectiveness. This would allow the learning to increase its efficiency in a permanent way. For instance, imagine that we found training efforts dedicated to improving leadership skills increased the learning ROI twice as much as training efforts toward developing technical skills. Or that training in one particular region is delivering 20 percent lower learning ROI than the national average. The learning team could use these benchmarks as a key indicator to improve the performance of their learning actions and better contribute to the business.
This approach can be used by any organization that has an important number of autonomous units, like the stores in this business case. The units need to make sense from a business perspective, and their numbers need to be large to allow statistical power. As mentioned earlier, other industries may easily implement this approach by looking at training effort and business performance in their own business units (factories, departments, etc.). This would allow these organizations to better justify their learning efforts and emphasize the benefits of becoming a fully learning organization.