


In 2020, companies in the United States spent $82.5 billion dollars on learning and development, according to the “2020 Training Industry Report,” even as COVID-19 began to take a toll on expenditures. That kind of investment in people, technology and programs is substantial but hardly surprising. A PwC report, “Talent Trends 2019: Upskilling for a Digital World,” found that 79 percent of CEOs worldwide are concerned that a lack of essential skills in their workforce is threatening the future growth of their organization. The investment made to close those gaps inevitably places pressure upon learning organizations to show a return and demonstrate how they drive value in KPI and ROI terms. If we’re accountable as learning leaders, asking whether a new program or approach directly contributed to a lift in revenue, a drop in support calls or an increase in customer satisfaction are fair questions. As we all strive to meet the challenges of work and learning in a pandemic-stricken world, rapid experimentation with new approaches has become mandatory and questions of what works and what doesn’t become even more pressing.
But answering those questions is harder than it seems. Over the years, industry reports from sources like ATD’s “Evaluating Learning: Getting to Measurements that Matter” have repeatedly indicated that while most organizations routinely capture Level 1 (reaction) and Level 2 (learning) data, level 3 (behavior) and level 4 data (results) are obtained by just 35 percent of organizations. That this finding has remained largely unchanged since the survey was first launched in 2009 suggests we may have hit a ceiling of sorts.
It’s not for lack of interest. Other reports show a strong desire among leaders to evaluate better and more broadly. According to LinkedIn’s “2020 Workplace Learning Report,” learning leaders said their most important area of strategic focus for 2020 was evaluating the effectiveness of learning programs. The same survey revealed that one in five learning leaders said that demonstrating the value of learning was among their top three challenges in the near term.
There is a genuine desire within learning organizations not just to move the needle with regard to KPI, but to continuously innovate and improve as a team, and evaluation is the best tool we have to do that.
Why is learning’s impact so hard to accurately measure?
Measuring the true impact of learning solutions is hard to do for myriad reasons, including a lack of data, time or resources to conduct evaluation, and maybe the biggest reason — the difficulty of isolating learning as a cause of improvement.
Historically one of the biggest challenges in assessing the impact of learning programs has been accessing the performance data necessary to make comparisons. However, that has shifted in recent years as learning platforms are capturing better data and business intelligence and finance teams have become more willing partners in pulling the data we need.
Still, even with better access to performance data, the method frequently used to quantitatively measure the results of a newly deployed program is itself limiting. A new program is rolled out to its target audience and KPIs are measured over some period of time. If a change is seen in the data — say, revenue, error rates or customer satisfaction scores — that change is attributed to the new program. But should it be? Unfortunately, this approach is problematic.
The inherent challenge in adhering to a Kirkpatrick-style evaluation approach is that the further out you get from the learning event itself (e.g., “the levels”), the harder it is to isolate the event’s impacts from what researchers call confounding variables — factors out of your control that directly affect the data you’re trying to measure.
Example: sales onboarding
Let’s look at a simple scenario. A sales team is onboarding 500 new hires. Results from the usual onboarding have been acceptable, but a new and improved version of the program is planned that will incorporate upgraded content, activity enhancements, a smarter delivery blend and new approaches to follow-up coaching. The new program is deployed, and performance data are tracked over a six-month period following the program launch. The results for one key measure are charted below and clearly show an overall improvement (D).
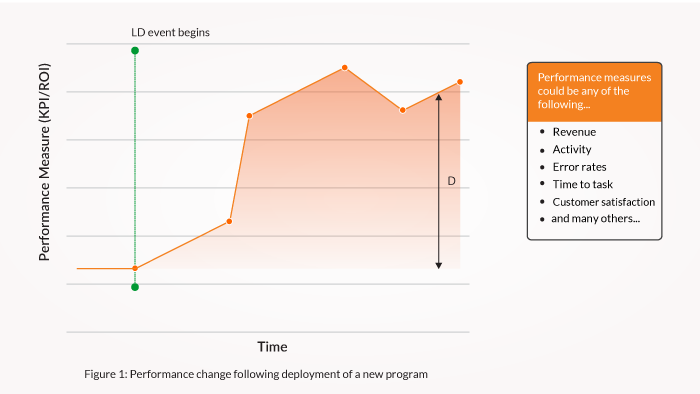
Based on these results, can we conclude the program was effective? It’s tempting to say yes, but the truth is we don’t know. Let’s look at why that is.
When data hide the truth: the danger of correlations
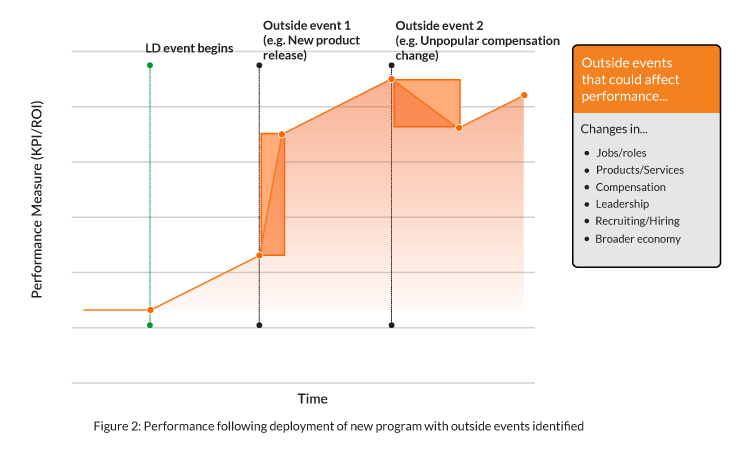
It is nearly impossible to deploy a new training program in a vacuum. There are all kinds of things happening inside and outside an organization that affect performance. Returning to our sales example below, notice the occurrence of initiatives unrelated to L&D — we’ll call these “outside events” — and the noticeable change in performance following each.
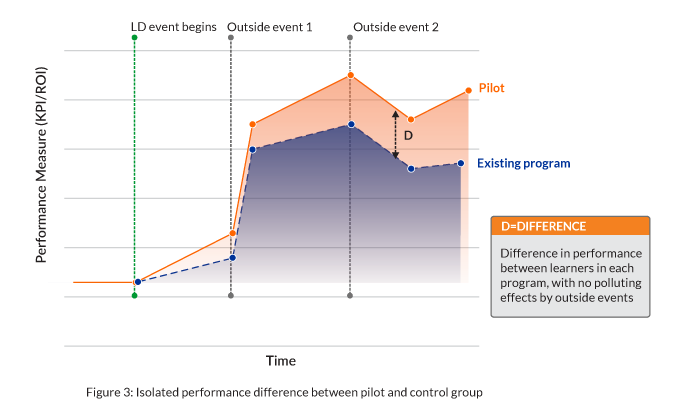
- Participants in a pilot group should be a representative subset of the overall target audience (preferably randomized to the extent possible) and compared against some or all of the remaining target audience.
- During the pilot, performance data should be captured and tracked for both groups for long enough that the desired effects have time to emerge. Be sure to allow time for your full solution to play out. For example, it should allow time for any coaching/support elements to have their effect.
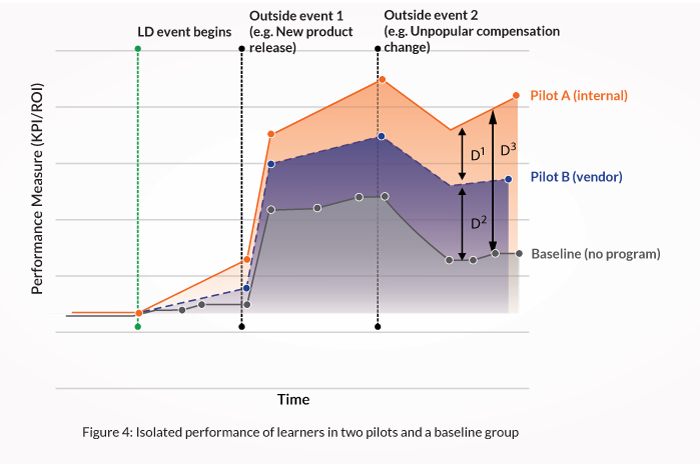
- Consider adding a second pilot group to the mix if you’re comparing two variations of a new program.
What would adding a “baseline group” get us?
Let’s adjust our scenario and say that sales leadership wants to boost prospecting skills and is comparing the results between a vendor-supplied program against a new, internally developed program. This would be program versus program, like our previous scenario — but what if we also track performance of those not going through either program — a “baseline” group?
Results could look like this:
- Is the stated goal of the program or strategy to directly influence one or more performance measures? All programs hope to influence improvement, but only some solutions are genuinely expected, by themselves, to result in measurable performance benefits. If your program is in the latter group, it may be a candidate for this approach.
- Would the program’s deployment mean a substantial investment or change-management effort? Definitely consider this method when evaluating a new program that, if it were deployed broadly, would require a big change in investment, delivery approach, time to competency, hiring cycles and so forth.
- Can you get the right data partners? Use this approach when outcome data can be gathered over time and analyzed in partnership with other business units. Lou Tedrick, VP of Global Learning and Development at Verizon, says, “The key is having strong relationships with business partners who are open to sharing performance data and with finance who can help us monetize the value of KPIs. By looking at both, we can measure the impact of learning on the business and the financial ROI.”
- Are there other big changes happening beyond L&D? Consider this approach when you know in advance that the organization is rolling out changes that could conceal learning’s impact and you want to isolate its effects.
- New programs
- Programs with updated content, interactions and activities
- Alternate delivery approaches for the same program
- Alternate approaches to post-training support, coaching or mentoring