


On the first Friday of every month the United States Labor Department releases its figures on how many jobs were added to the economy. Its release sparks a rash of media pundits, economists and business leaders willing to offer their analysis of the figures. Throw in the media spin typically associated with an election year, and it becomes increasingly difficult for executives to discern what is actually meaningful.
But the jobs report doesn’t tell the whole story. Using government data, and with the help of our own in-house research team, we’ve compiled a more holistic snapshot of the talent economy. Further, we’ve interviewed two economists to add perspective to the figures.
Employment
Despite the rhetoric coming out of the political season, the health of the U.S. labor market is mostly solid. “The labor market today is in remarkably good health,” said Andrew Chamberlain, chief economist at employer reviews website Glassdoor. The U.S., Chamberlain said, is about 87 months into its current economic expansion, which started in mid-2009. The last notable economic expansion of this magnitude — 92 months — occurred in the 1980s. Furthermore, the U.S. economy has seen 72 consecutive months of positive growth in the number of jobs created nationally, the longest stretch on record since the government began collecting this data.
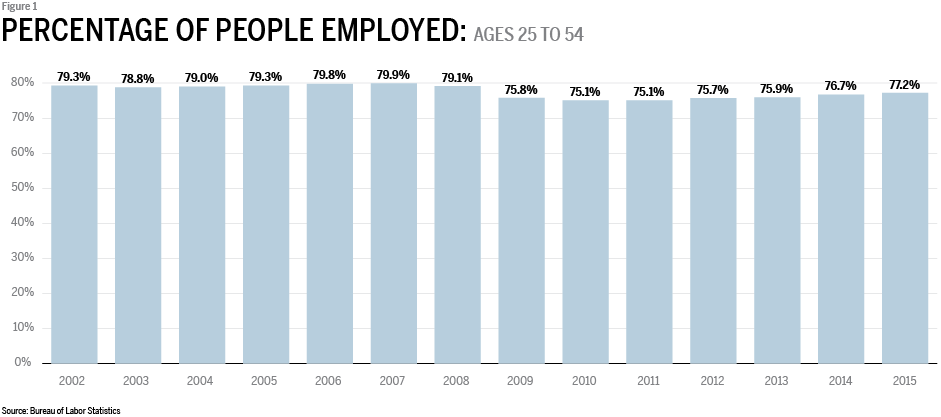
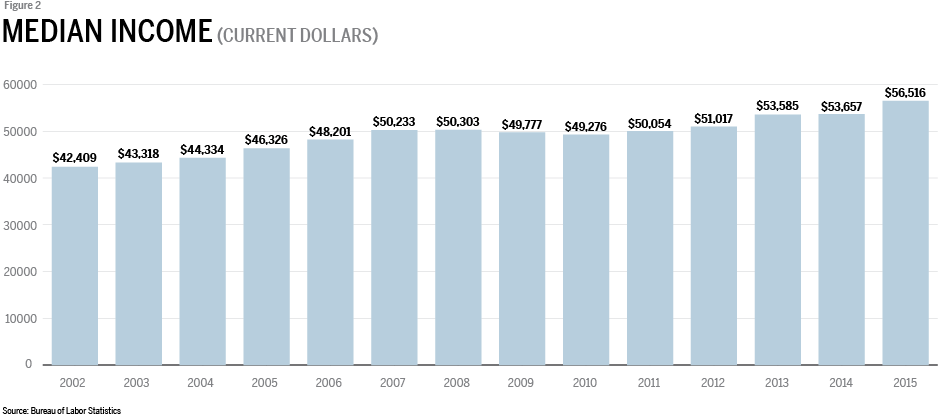
More than 77 percent of Americans between ages 25 and 54 are employed, a number that has been on the rise since the most recent recession, according to Bureau of Labor Statistics compiled by Talent Economy’s research team (Figure 1). Along with those who are employed, the median income and gross domestic product, or GDP, have also seen continued growth in recent years.
Productivity
Although government figures on productivity have been underwhelming — much of which has to do with the methods used to measure the metric, which some have argued is no longer relevant to today’s modern economy — the economists we interviewed were bullish on overall economic output.
Productivity is currently on a bit of a downturn. According to the U.S. Bureau of Labor Statistics, from the second quarter of 2015 to the same period in 2016 it saw a 0.4 percent decrease.
New technologies and a continued increased in overall intellectual capital, however, mean the economy’s productivity may actually be better than these numbers reflect. “You can still have sustained economic growth forever because we get smarter and we work better,” Chamberlain said. “As long as there are new ideas that help us get the same amount of stuff done in a lesser amount of time, you can still have growth forever.”
Added Steve Nyce, a senior economist at Willis Towers Watson and director of the firm’s Research and Innovation Center: “The American worker can be extremely productive in many ways, especially when coming to developing new intellectual capital.”
Nyce said new technological advancements are nearing the point where they will be reflected in reported productivity figures. “We are on the doorstep of a productivity surge of sorts once the advancements in genomics, artificial intelligence, etc., are absorbed into the business world,” Nyce said. The levels of debt, aging population, value of education will likely be a drag on this growth. “But we have plenty of opportunities as well through investments in the real economy and human capital to propel us forward,” Nyce said.
Wages, which have remained somewhat stagnant amid soft manufacturing productivity, have recently started to rise, according to Bureau of Labor Statistic data compiled by Talent Economy. The median income (in current dollars) rose by more than $10,000 in the past 10 years ($46,326 in 2005 to $56,516 in 2015) (Figure 2). However, Nyce said such increases aren’t much when inflation and rising health care costs are taken into consideration. “It’s not just are we growing, it’s the rate at which we’re growing and how a slow-growth environment makes it challenging on all aspects,” Nyce said.
Debt
According to The U.S. Census Bureau, the number of households with debt is improving: 74 percent of households had debt in 2000, compared to 69 percent in 2011. The amount of debt, however, is on the rise. Total household debt, secured debt and unsecured debt is rising for all age groups, according to a report from the Census Bureau.
Nyce said that many workers who own houses have a fixed debt in terms of their mortgage. If they don’t get raises and promotions at work, that mortgage becomes harder to pay.
Second to mortgage debt is student loan debt. “What you’re seeing is a whole class of new employees entering the labor market with much more debt than any other generation has experienced,” Nyce said. “On top of that, they’re facing stagnant wages or not getting the same level of wage increases per year, which makes it more difficult to pay off that debt.”
Nyce said that, although education is the key to improving the economy, he’s concerned about the cost of attainment. Chamberlain looks at student debt differently. “The way you want to think about student debt is as an investment, just like any other investment.” Total debt to Chamberlain doesn’t matter; what matters is payment per month. If a college education helped raise a worker’s earnings by $300 per month, he said, and the loan payment was $250, then the worker is still better off with the higher education.
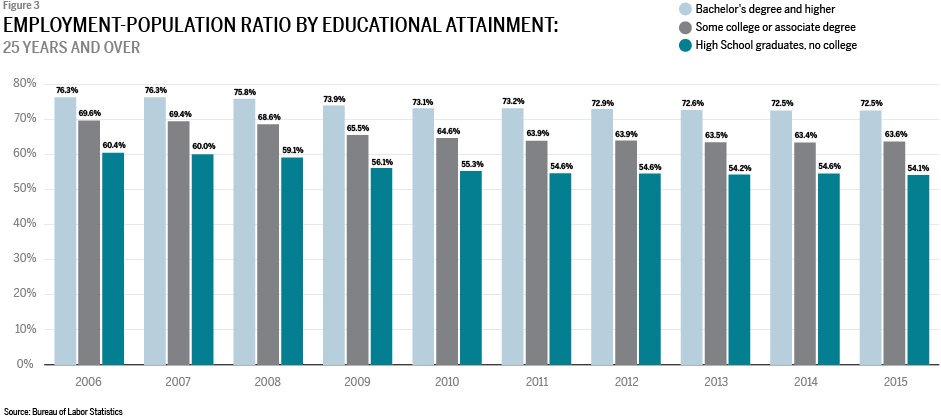
According to the Bureau of Labor Statistics data compiled by Talent Economy, the employment-population ratio by educational attainment of people aged 25 and older shows that since about 2010 those with college degrees are nearly 20 percent more likely to get a job than those with only a high school education (Figure 3).
Population Sentiment
Even though these figures offer an optimistic view of the state of the talent economy, a negative sentiment prevails. “If you ask people on the street, most people will take a dimmer view of how the labor market is doing because there definitely are pockets of weakness in the expansion,” Chamberlain said, “especially regarding wage growth and certain industries that are not enjoying the fruits of this expansion.”
Those who typically see the best wage growth live in urban areas, Chamberlain said, while energy and manufacturing industries are typically clustered in rural areas. With a dark cloud over those two fields of late, the populations in rural areas face higher unemployment and fewer job opportunities than people living in or near cities.
“There is a huge divide, and that has fueled wealth inequality between those two areas, and that’s why I think there is such a big disagreement about how good the economy is doing,” Chamberlain said.
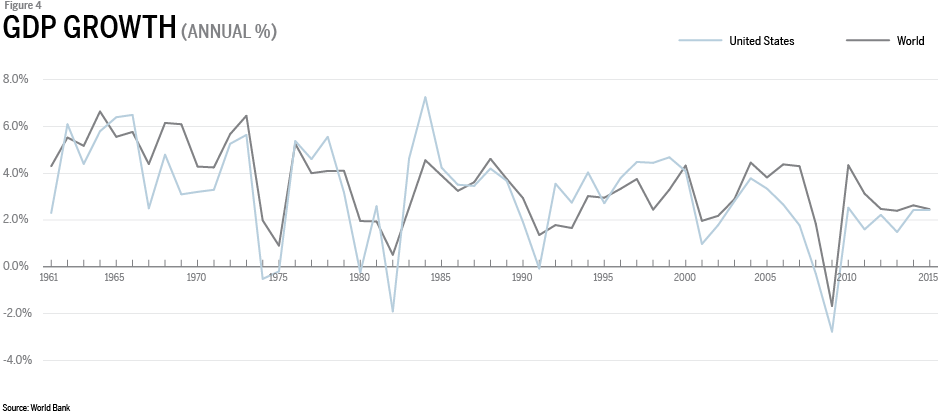
Adding to this is the relatively slow GDP growth. Although it continues to rise year over year, GDP hasn’t increased by any more than 2.5 percent in the U.S. since 2010 (Figure 4), according to data from the World Bank compiled by Talent Economy, compared to the 4 percent and higher growth experienced in the late 1990s and the 6 percent growth in the mid-1960s.
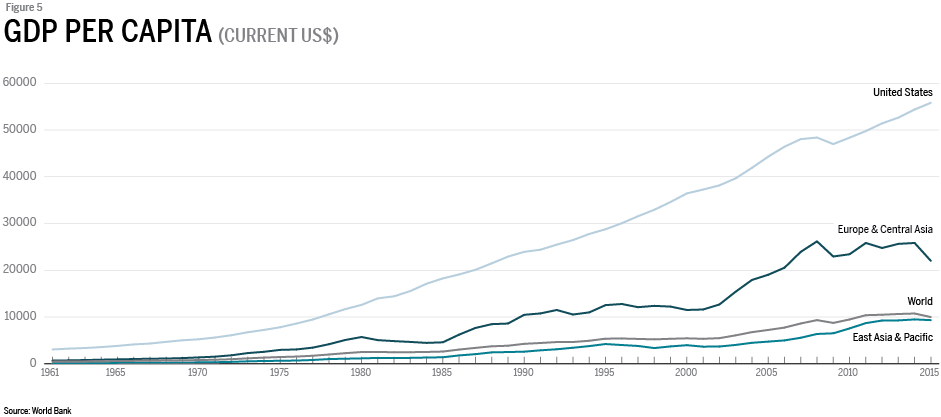
In relation to the rest of the world, however, the U.S. maintains a fantastic standard of living. According to World Bank sources compiled by Talent Economy, the GDP per capita in the U.S. is more than twice that of Europe and Central Asia. Compared to the world GDP per capita, the U.S. is currently at rates more than five times higher than the world average (Figure 5).
Lauren Dixon is an associate editor at Talent Economy.